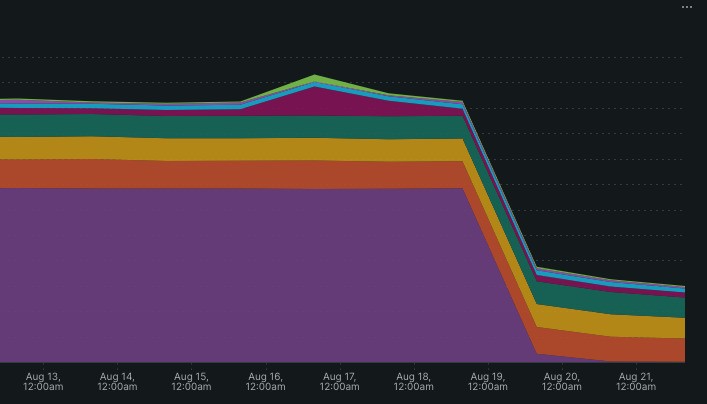
I was doing some health checks on some new brownfield projects we’ve taken on recently, ahead of migrating them to our own infrastructure. And I noticed that their NewRelic invoices seemed abnormally high for the amount of traffic the stores received. I was expecting most of the stores to still be in the free tier, or at least under 200/300GB total ingest.
Looking at the “Manage Data” account page in NewRelic. Tracing data dominated the ingest graph, in all the cases it exceeded over 50% of total data and up to 80% in a few stores.

Recalling a few years back, I remember we had a similar case happen. Where NewRelic changed the default to enabled for distributed tracing in the PHP agent. And its typical to find a lot of NewRelic implementations using the default settings.
What is Tracing Data in NewRelic?
NewRelic Tracing data essentially provides a internal connection that allows us to track a single request through all of our services. For example, it might link together a frontend browser span with the relevant backend span.
It can be helpful for tracing the root cause of certain issues across the entire stack. For example, if some requests are seeing high TTFB, we can trace back connected backend spans while hopefully will reveal the root cause of the issue.
How do we reduce the amount of tracing data ingested?
We don’t typically use tracing data that much with our use case of NewRelic, instead focusing on each component separately. Tracing data is just a wasted cost for us, so we disable tracing data from the PHP agent. We do this by disabling the newrelic.distributed_tracing_enabled and newrelic.span_events_enabled properties in our newrelic PHP ini files (make sure our changes cover both CLI & FPM).
newrelic.distributed_tracing_enabled = false
newrelic.span_events_enabled = false
A few days after actioning this change, we can see a massive reduction in the amount of data ingested into NewRelic. And if we run into a situation where we would benefit from tracing, its simple enough to re-enable.
